First Look at Non-Drivers in Dane County
Susan De Vos | May 28, 2025
It may come as a surprise to some that even with a rather restrictive definition, between 30 and 40 percent of Dane County's population is non-driver according to the Wisconsin Department of Transportation. Non-drivers are restricted to those who do not have a registered car or driver license. They tend to be youths, aging adults, low-income individuals, disabled people or people who just prefer not to drive themselves. They also live throughout Dane County. Someone who mainly uses a non-car travel mode such as a bicycle but still drives a motor vehicle on occasion may be an ally but is not a non-driver according to this definition. In contrast, someone who rides everywhere in a car but is always driven by someone else is a non-driver. This is a short geographic overview of non-drivers in Dane County based on information from the Wisconsin Department of Transportation s Non-Driver interactive mapping tool that put merged Department of Motor Vehicle and US Census data in map form.
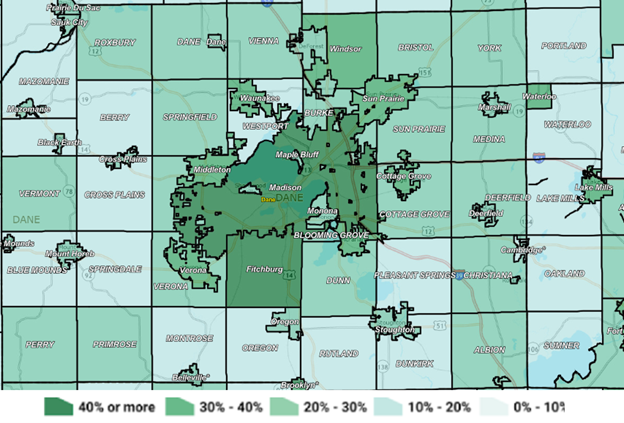
An Evolving Dane County of Towns, Villages and Cities Over time, the county has become increasingly urbanized in a process that continues to this day. Some of what were once independent villages have become small city suburbs of an expanding Madison Metropolitan area. By 2024, the city of Madison has largely stopped its expansion through the annexation of neighboring land because it is now surrounded by a set of smaller cities that themselves were once villages but grew through annexation. Or if not yet technically a city, they are larger, more urban and will most certainly soon adopt the “small city” moniker. Although estimates vary, the UW Extension reported that about 4% of the county’s workforce was still engaged in agricultural work in 2012; that 66% of the county’s land was owned and managed by farmers. By 2020, only 49% of the land might still have been devoted to agriculture. Given such continual change, Figure 1 provides a snapshot of the non-driver situation as of 2024. Figure 1 has a legend for five intensities of green reflecting the population proportion of non-drivers: 0 10%, 10-20%, 20-30%. 30-40% and 40+%. The greater the intensity, the higher the proportion. Thus, the village of Mazomanie on the upper left has a medium green corresponding to a population proportion of 20-30% non-driver while the remaining township known as the Town of Mazomanie has a paler green color corresponding to a 10-20% proportion non-driver. The city of Middleton off the left shore of Lake Mendota is colored a more intense green corresponding to a proportion of 30-40% non-driver while the remaining township called the Town of Middleton is colored the medium green color corresponding to the proportion of 20-30%. Figures for such cities as Fitchburg and Madison are colored deep green corresponding to their overall averages of 40+% non-driver. In contrast, the well-to-do neighboring villages of Shorewood Hills (west) and Maple Bluff (east) are colored with the medium green of 20-30%. Two immediate takeaways are that 1) population centers tend to have a higher proportion of non-drivers than less dense peripheral areas and that 2) all areas have at least 10% of their population non-driver. Regarding the first takeaway: We already noted that the Village of Mazomanie has a higher proportion of non-drivers than the unincorporated town. The same is true of Black Earth and elsewhere, and of villages turned into small cities. For example, the small city of Verona has a proportion of 30-40% non-driver while the unincorporated town of Verona has a proportion of 20-30%. Although we can speculate that the higher density of villages or cities is associated with more places that people can walk or bike to such as stores or schools, it really is impossible to know without digging further what causality is involved — whether non-drivers are attracted to villages/cities because they can function there more easily without driving, or whether residents of villages/cities find it easier to forgo cars while meeting needs. Maybe both? The second takeaway is at least as important as the first. Because the map shows that non-drivers are everywhere, all areas having at least 10-20% of their populations non-driver. None is in the 0-10% category. This is an important point because many people — both advocates and opponents of transportation options alike — erroneously link non-driver existence to urban living. While it is true that population centers such as villages have higher overall population proportions non-driver than adjacent towns, nowhere is there a population proportion non-driver under 10%. That substantial numbers of non-drivers exist in rural areas makes it all the more curious and unnecessarily divisive that the area’s transportation planning organization (MPO) has to limit itself to only the part of Dane County that is urban and in the Madison Metropolitan Area. Especially since the US Census keeps changing its “urban” definitionto compensate for growing rural populations and even so keeps expanding to include more of the county. The latest MPO plan projects an increase of another 195,000 people by 2050, putting to rest the idea that it should not just embrace the entire county as its region of focus. Better meshing the administration of transportation planning with the administration of other county functions such as land use planning just makes sense.
Looking at Non-Drivers by Census Tract Provides Additional Information
Figure 2. Non-Drivers of All Ages by Census Tract - April 2024
(Overlaid With Map of Cities, Villages and Towns of Dane County) 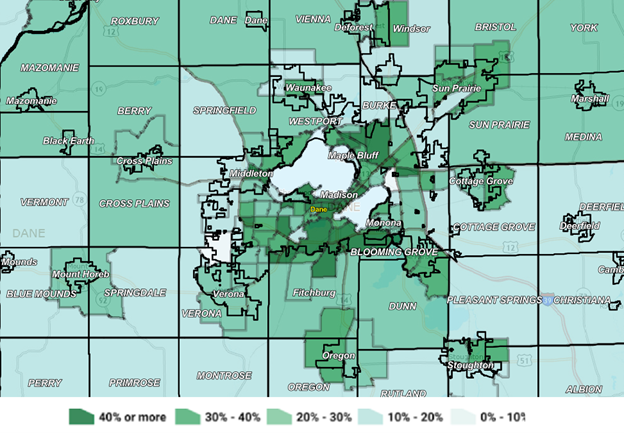
Source: https://experience.arcgis.com/experience/afd5879501f344039f2c2482e959cdf5/page/Page/ on 5/28/2025
Unfortunately, tract boundaries do not fit neatly within municipal boundaries. We try to compensate for this in part by overlaying the map of cities, villages and towns with the map of census tracts in Figure 2. Again, lower and greater intensities of green are associated with lower and greater population proportions of non-drivers. While a short summary cannot possibly specify all the differences between neighboring tracts throughout the county, at least the map can show that huge disparities exist and we can mention a few. Take for example the relatively small city of Stoughton in south-eastern Dane County. While the city overall has a non-driver proportion of 20-30%, the city's southern tract (133) is 10-20% non-driver whereas its north-western tract (122.02) is 20-30% and its north-eastern tract (122.01) is 30-40%. Or consider Sun Prairie and Fitchburg, competing to be the fastest growing city in Dane County. Southern tracts in Sun Prairie (such as 115.06) have the low proportion of 10-20% while tracts farther north (such as 116) have the higher proportion of 30-40%. Fitchburg’s census tract on its center-east northern border (14.05) has the maximum proportion non-driver of 40+%. The tract at its very south-eastern edge shared partially with the Village of Oregon — 125.02 — has a proportion of 30-40%. But most of the area, in Tracts 107.01, 107.2 and 106 (shared with the Town of Dunn), have proportions of 20-30%. Another general point is that even when burrowing down to the census tract level, only Madison has tracts with the lowest possible proportion of 0-10% non-driver: one tract on its west side (Tract 109.03; pop. 3,911) and one on its east side (Tract 27; pop. 3,170). Newer annexed areas on the east and west sides may have lower proportions non-driver than average while older areas and areas of lower income on the Isthmus, north and south sides of Madison may have above average proportions, but except for those two outliers no tract has a proportion under 10%. In sum, although a third of Dane County’s population may be non-driver, much recent land use planning seems to assume everyone who is anyone drives. Hopefully, this short piece has used Census and DMV data to show the assumption false. In 2024, between 30 and 40% of the residents of Dane County is non-driver. The assumption is also unnecessarily divisive. Someone who does not drive to an event because of age, income or disability is not participating in our community. And we are all the less as a result. Do non-drivers stay home rather than see the doctor, go to work or school, access childcare, make it to appointments, procure groceries and other goods, socialize or worship with others? If they get a ride from someone else, are both they and the driver in an unequal relationship bound to foster undue docility and anger on the one hand and resentment and guilt on the other? If people drive who should not, are they putting themselves and others at risk? We need transportation options that enable everyone to travel as independently as possible using a mode that is suitable, safe, inexpensive and accessible. |